
What does the October 2026 Bitcoin evidence show?
Bitcoin closed above its 200-day average on 11 October 2026, while US spot Bitcoin ETFs recorded net outflows over 5–9 October. These dated observations test different parts of a market thesis; neither establishes a price forecast.
Fixed snapshot: Bitcoin through 11 October, ETF flows through 9 October, US CPI through August 2026. Research methods.
The October brief · Published 12 October 2026. Bitcoin observations end 11 October; ETF flows end 9 October; consumer prices end August. This is a dated editorial analysis, with a different reporting clock for each source.
Bitcoin’s monetary case begins with a constraint: its issuance is governed by rules that participants can verify. Its investment case depends on what people are willing to pay for those units. Confusing those two arguments turns a useful criticism of fiat money into an unreliable price forecast.
The case for monetary rules survives a weak market. A market thesis still has to survive the evidence.
This month’s evidence is mixed. Bitcoin trades above its 200-day average, remains well below the highest daily close in our dataset, and faces a recent week of net ETF outflows. Consumer prices continue to expose the cost of holding unchanged cash. None of those observations cancels the others.
01 / Above the trend, below the peak
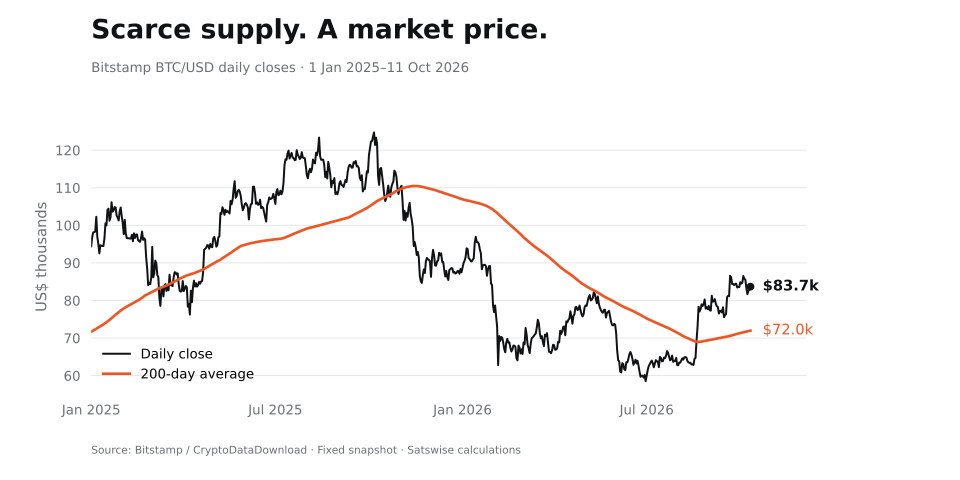
The 11 October Bitstamp BTC/USD daily close was $83,679, against a 200-day simple average of $71,981. The ratio was 1.163×. The close remained 32.9% below the running highest daily close in the retained dataset, which begins in November 2014. These calculations use the same complete daily series as our cycle research.
Scarcity does not remove market repricing

Source: Bitstamp daily OHLC via CryptoDataDownload. UTC dates; completed observations through 11 October 2026. Satswise calculations. Method and data limits.
Our interpretation: the trend evidence supports a recovery interpretation more readily than a claim that volatility has disappeared. An Austrian argument about durable monetary rules does not tell us which daily quote is attractive. Demand, financing and the willingness of existing holders to sell still determine the clearing price.
What would weaken this reading: persistent closes below the trailing average would weaken the trend observation. Strong price appreciation on a different venue would require a cross-venue comparison, rather than silently replacing this series. Neither test decides the long-run monetary argument.
02 / One institutional channel lost capital
The five completed US spot Bitcoin ETF sessions from 5–9 October sum to −$678.9 million in aggregate net flows in the Farside snapshot. The largest negative session was 7 October, at −$484.9 million. Two of the five sessions were positive.
Net outflows, with different daily contributions

Source: Farside Investors, retrieved 12 October 2026. Full retained observations and arithmetic.
Our interpretation: institutional access creates a demand channel, not an obligation to keep buying. These flows are a near-term headwind to that channel. They do not measure all spot demand, and an ETF holding may offset another position. A “monetary debasement trade” remains a claim about allocation until its capital flows are examined.
What would change the view: a sustained reversal across subsequent completed sessions would change the flow assessment. The next review should fix its window before reading the result, then compare fund holdings, price and hedged exposure. A single positive day is too little evidence to call a durable turn.
03 / The price level is the cost that remains
In the latest CPI release available for this brief, US all-items consumer inflation was 3.4% over the year to August 2026. More relevant to a cash saver’s accumulated loss, the unadjusted CPI-U price level rose 29.9% from January 2020. Unchanged cash therefore retained about 77.0% of its starting purchasing power against this basket, before interest and taxes.
Higher prices mean less purchasing power per unit

Source: BLS CPI-U via FRED, CPIAUCNS, not seasonally adjusted. January 2020–August 2026; retrieved 12 October. October 2025 is unavailable. Calculation and limitations.
Our interpretation: persistent erosion of an unchanged unit is a serious criticism of inflationary money. The conclusion is about purchasing power, not a proof that Bitcoin must rise when the next CPI number rises. In its July report, the Federal Reserve identifies supply shocks as part of the inflation picture. A credible monetary critique must examine production and energy as well as money and credit.
The next evidence: BLS schedules the September CPI release for 14 October 2026. Compare the new monthly and annual changes with the accumulated price level. A slower annual rate would not by itself reverse the earlier increase in prices. Read our inflation and cash analysis for the distinction.
A monetary conviction needs a separate market test
Our starting position is that monetary competition and verifiable issuance deserve serious consideration. A savings system should make dilution visible and give people meaningful choice. Bitcoin supplies an unusually inspectable rule set; holding an ETF share or a platform balance introduces an additional institution between the holder and those rules.
For a strategic reader, keep two notes. The first states why the monetary institution deserves trust. The second states what the dated market evidence supports and what would weaken that interpretation. Treating every drawdown as confirmation of the first note makes the second impossible to test.
Continue with the Austrian case for monetary choice, then examine what ownership means in practice. Conviction becomes stronger when it can name both its mechanism and its limits.
Sources, dates and method
Price and trend use all completed daily Bitstamp closes in the retained archive, with the same-venue 22 May 2026 gap correction documented in the cycle guide. The 200-day average is an arithmetic mean; drawdown uses daily closes within the dataset, excluding intraday highs. The display begins January 2025; calculations use the full retained history. ETF data is a short attributed excerpt, not a complete institutional demand series. CPI is US urban consumer inflation, not global inflation or every reader’s cost of living. Editorial interpretations and proposed review criteria are Satswise’s; no causal coefficient or price forecast is claimed.
- CryptoDataDownload — Bitstamp daily observations
- Farside — US spot Bitcoin ETF flows
- BLS — August 2026 CPI release and next release date
- FRED / BLS — unadjusted CPI-U series
- Federal Reserve — July 2026 monetary policy report
Updated 13 Oct 2026: Added a concise answer, evidence limits and topic reading paths. Underlying source reviews and chart observation cutoffs remain unchanged. Report a correction.