
Does falling inflation restore purchasing power?
A lower positive inflation rate means prices rise more slowly. It does not reverse earlier increases. For an unchanged cash balance, purchasing power against a price index equals the starting index divided by the later index.
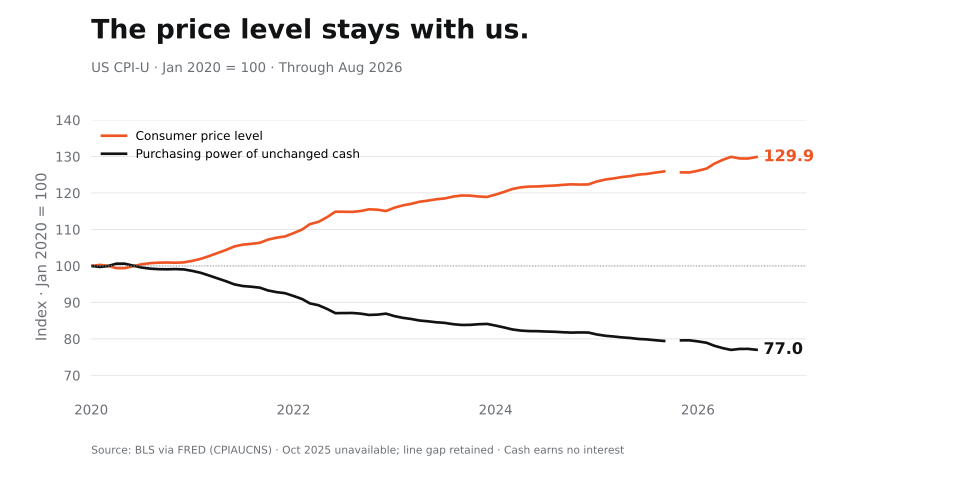
Observed US CPI through August 2026; the constant-rate examples are hypothetical and exclude interest. Research methods.
A cash balance can stay unchanged while its owner becomes able to buy less. Inflation makes that loss easy to overlook because the account still displays the same number. The monetary unit, rather than the arithmetic in the account, has changed.
The strongest criticism of inflationary fiat money begins with that consequence. It then asks whether an institution should routinely reduce the purchasing power of an unchanged unit, how the policy is constrained, and who can protect themselves from the adjustment.
A slower rate does not restore the earlier price level
Price inflation is an increase in a price index. Disinflation is a slower rate of increase. Deflation is a falling index. Prices rising by 2% after rising by 8% are still rising; the earlier increase remains in the level.
For the US urban-consumer basket, January 2020’s unadjusted CPI-U was 257.971. August 2026’s was 334.980. That is a 29.9% increase. Against the same basket, unchanged cash retains about 77.0% of its January 2020 purchasing power. The loss is 23.0%, rather than 29.9%, because purchasing power is the reciprocal of the price level.
The two sides of purchasing-power erosion

Source: BLS via FRED, CPIAUCNS. Not seasonally adjusted; January 2020–August 2026; retrieved 12 October 2026. Method and missing-data note.
A small annual target still compounds
The Federal Reserve targets 2% inflation over the longer run using the PCE price index. PCE and CPI are different measurements. A policy target is also different from an achieved outcome.
Even if annual price inflation were exactly 2%, a non-interest-bearing cash balance would retain only 55.2% of its starting purchasing power after 30 years. At a constant 4%, it would retain 30.8%. These scenarios isolate compounding; they do not forecast future inflation.
“Low inflation” still has a cumulative cost

The Satswise criticism: evaluating monetary success only against an annual rate can obscure the cumulative cost borne by people holding the unit. The ability to earn interest, own assets or negotiate wages is uneven. A system that requires repeated financial adaptation to preserve purchasing power deserves scrutiny, even when its annual target is met.
Money creation and consumer inflation are different measurements
Austrian discussions often use monetary inflation for an expansion of money and credit. Modern statistical releases usually use inflation for price changes. An argument should say which definition it uses.
The Bank of England describes commercial-bank lending as a major source of new deposit money. This is not a simple story of a printing press producing every unit. Loans create matching deposits; repayment of principal reverses that creation. Monetary policy, capital requirements, financing constraints and demand for credit affect the process.
An expanded money stock does not translate into a fixed, immediate percentage increase in CPI. Cash demand, production, supply disruptions and where the new money is spent matter. As Mises emphasizes in his monetary writings, changes can reach individual prices unevenly. That is a reason to trace the mechanism, rather than overlay two rising curves and call the result proof.
What the critique must allow for
Prices can rise because important goods become harder to produce or deliver. The Fed’s July 2026 report discusses energy and other supply shocks alongside monetary conditions. The CPI chart alone cannot attribute its increase to government spending, bank lending or any single cause.
Some wages, interest payments and asset values also rise. A CPI-based calculation of unchanged cash does not establish that every household’s real wealth fell by the same amount. BLS explains that the CPI is an average measure for a specified consumer population, not each household’s personal cost of living.
Nor does monetary criticism establish Bitcoin as a reliable hedge over every holding period. A volatile asset can have constrained issuance and still lose purchasing power over the period in which a reader needs to spend it. Monetary design, demand and ownership must each be examined.
Better questions for a strategic reader
- What happened to the accumulated price level, rather than only this month’s inflation rate?
- Did income or the cash balance grow enough to offset that change, after relevant costs?
- Which spending categories actually matter to the household or business being studied?
- What monetary rule, redemption promise or institution supports the proposed alternative?
- Can that alternative serve the required horizon without depending on favourable refinancing?
Read the distributional route of new money and the Austrian argument for monetary choice. Our October brief applies the distinction between monetary conviction and market evidence.
Data, arithmetic and limitations
Inspect the calculation and observation scope
Input: BLS all-items CPI-U for the US city average, not seasonally adjusted, FRED series CPIAUCNS. Starting value 257.971 in January 2020; ending value 334.980 in August 2026. Price increase = (334.980 / 257.971 − 1) × 100. Remaining purchasing power = (257.971 / 334.980) × 100. The retained snapshot has 79 published observations across 80 calendar months.
October 2025 is unavailable and is left as a gap. BLS documents the shutdown’s effects on October and November measurement; later published values retain the agency’s methodology. Satswise does not interpolate the missing month. Endpoints are observed values; the analysis is descriptive, not a reconstruction of the data available on every historical date.
Evidence essay reviewed 12 October 2026. The observed chart is US-specific; it is not global inflation, an asset-price index or a measure of each household’s wealth. Constant-rate examples are hypothetical. The judgment about monetary institutions is an editorial position. September 2026 CPI had not been released at the review date.
- FRED / BLS — CPI-U, not seasonally adjusted
- BLS — August 2026 consumer price release
- BLS — CPI definitions and population coverage
- Federal Reserve — PCE inflation objective
- Bank of England — money creation
- Mises — monetary theory and non-neutral price changes
Updated 13 Oct 2026: Added a concise answer, evidence limits and topic reading paths. Underlying source reviews and chart observation cutoffs remain unchanged. Report a correction.