
What do spot Bitcoin ETF flows measure?
Net ETF flows describe capital entering or leaving the fund structure during a reporting period. They measure one route into Bitcoin exposure. A fund position may be hedged elsewhere, so net inflows do not establish an investor’s full directional exposure.
Short attributed Farside excerpt through 9 October 2026; investor motives remain unknown. Research methods.
What are Bitcoin ETF net flows?
Spot Bitcoin ETF net flows describe capital entering or leaving the fund structure over a reporting period. They are useful evidence about an important route into Bitcoin exposure. They do not capture the whole spot market, offshore funds or every investor’s economic position.
A headline about fund assets can describe something else. Assets under management change when the underlying asset’s price changes as well as when investors add or withdraw capital. Separate a flow number from a change in market value before making a claim about demand.
| Measure | Meaning | Limit |
|---|---|---|
| Net flow | Creations less redemptions over a period, expressed in value | Does not identify investor motives or offsetting positions |
| Assets under management | Value of assets at a point in time | Changes with Bitcoin’s price as well as flows |
| Trading volume | Shares changing hands on an exchange | Secondary-market trading need not create new fund shares |
| Bitcoin holdings | Coins held by the fund | Separate share creation, redemption and operational adjustments |
In a simplified hypothetical fund, 100 BTC priced at $60,000 produces $6 million of assets. If the price rises to $66,000 and holdings stay at 100 BTC, assets rise to $6.6 million with no new capital. If a creation adds 10 BTC at $66,000, the additional exposure is $660,000. The $600,000 price gain and the $660,000 creation describe different changes; fees and cash balances are omitted here.
How ETF creations and redemptions work
Authorized participants interact with the fund’s creation and redemption process; exchange investors usually trade existing shares. In July 2025, the SEC permitted in-kind creations and redemptions for crypto ETPs. A cash process and an in-kind transfer of Bitcoin have different operational routes. Check each fund’s current prospectus rather than assuming every reported flow means a same-day cash purchase on an exchange.
Historical Bitcoin ETF flows: September–October 2026
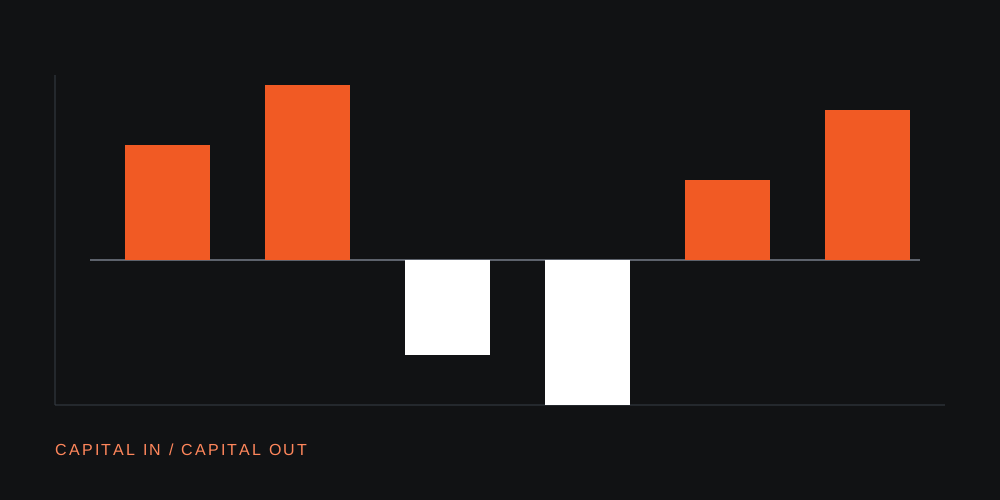
Flows change direction across sessions

Source: Farside Investors, retrieved 12 October 2026. Last completed observation: 9 October. This is a fixed research snapshot.
The final five completed sessions sum to $678.9 million of net outflows. Two sessions in that window still recorded inflows.
That is evidence of net withdrawals through this channel over this window. It does not identify the motives of the investors involved. A few large sessions can dominate a short total, which is why both the bars and the sum deserve attention.
View the observations and calculation
| Session | Net flow |
|---|---|
| 2026-09-23 | +346.9 |
| 2026-09-24 | +190.7 |
| 2026-09-25 | +134.5 |
| 2026-09-28 | +31.0 |
| 2026-09-29 | +66.2 |
| 2026-09-30 | -148.7 |
| 2026-10-01 | +102.7 |
| 2026-10-02 | +189.9 |
| 2026-10-05 | -89.8 |
| 2026-10-06 | +118.8 |
| 2026-10-07 | -484.9 |
| 2026-10-08 | -244.1 |
| 2026-10-09 | +21.1 |
Five-session total: −89.8 + 118.8 − 484.9 − 244.1 + 21.1 = −678.9 million. Only completed reported sessions are included. A pending row with dashes is not interpreted as a zero-flow observation. The sample is too short to construct a 20-session total.
Why ETF inflows can accompany futures shorts
CME describes a cash-and-carry structure in which an investor holds spot exposure, including an ETF, while selling futures. The investor can seek the difference between spot and futures prices. The ETF position is then part of a broader trade with offsetting exposure.
This does not mean ETF flows are uninformative. It means a flow cannot reveal net conviction by itself. Looking at futures basis and positioning alongside the flows can help explain which interpretation is plausible.
The Bitcoin futures basis guide works through an offsetting trade and its financing and margin costs. Compare it with funding rates and open interest before interpreting futures shorts as bearish conviction.
How to interpret ETF flow persistence
- Persistence: Compare fixed 5- and 20-session totals when enough completed data is available.
- Participation: Ask whether the aggregate comes from several funds or one unusually large session.
- Holdings: Examine changes in coin holdings separately from price-driven changes in AUM.
- Positioning: Consider whether related futures exposure may offset the spot position.
Our strategic interpretation is that flows become more useful when their persistence and market context are explicit. They are one demand channel, with a reporting schedule and scope, rather than a complete explanation of a price move.
ETF flow sources and snapshot scope
Chart note reviewed on 12 October 2026. Thirteen daily aggregate observations are transcribed from Farside’s published table and checked against its displayed totals. The five-session calculation is Satswise’s. The chart makes no attribution of investor motives and contains no price forecast.
- Farside Investors — US Bitcoin ETF daily flow table
- iShares — Bitcoin ETF holdings, assets and fund documents
- SEC — In-kind crypto ETP creations and redemptions, 29 July 2025
- CME Group — Spot ETFs and crypto basis trading
Updated 13 Oct 2026: Added a concise answer, evidence limits and topic reading paths. Underlying source reviews and chart observation cutoffs remain unchanged. Report a correction.