
How do funding rates differ from open interest?
Funding rates describe transfers between long and short perpetual-futures positions. Open interest counts outstanding derivatives exposure. Together they help frame positioning questions, but neither identifies net conviction or predicts a liquidation by itself.
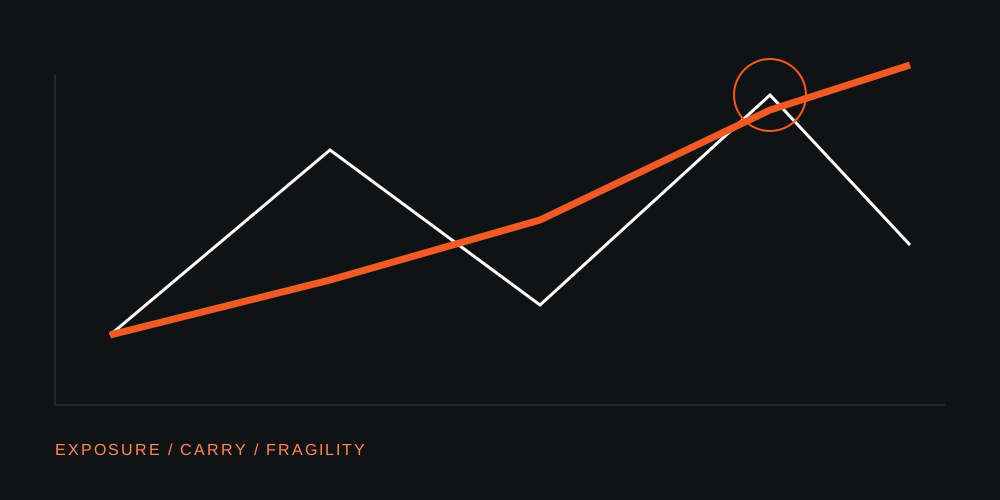
Conceptual framework; no live derivatives series or liquidation forecast. Research methods.
Bitcoin funding rates are transfers between long and short perpetual-futures positions. Open interest counts outstanding derivatives exposure. Funding measures the cost and direction of the transfer; open interest measures how much remains open. Neither reveals net market conviction by itself.
What is Bitcoin open interest?
A leveraged position allows market exposure larger than the capital posted to support it. That changes how a participant responds to a move: losses can trigger margin requirements or forced closure. An investor reading the cycle needs to understand both the direction of demand and the fragility of the positions carrying it.
Open interest measures outstanding derivatives contracts. Every contract has two sides. An increase does not, by itself, mean the market has become more bullish. Dollar-denominated open interest can also rise mechanically as Bitcoin’s price increases, even if the number of contracts is unchanged.
How Bitcoin funding rates work
Perpetual contracts use funding transfers to help keep their price near an underlying reference. Positive funding generally means longs pay shorts; negative funding reverses the direction. The exact formula, interval and treatment vary by venue and contract.
A large positive reading can be consistent with demand for leveraged long exposure. It is not a countdown to a decline. Crowded positions can remain crowded, and comparing two venues without aligning funding intervals can produce a misleading ranking.
Ask two questions about positioning

$100,000 notional × 0.01% per eight hours = $10 per interval.
If unchanged for three intervals, the transfer totals $30 in a day.
This example assumes a fixed notional and a hypothetical eight-hour interval. Actual venues can quote a rate for one period while collecting payments continuously or on another schedule. Positive funding creates a payment obligation for the long in this example; it does not include price losses, trading fees or borrowing costs. A single reading cannot be extrapolated into a promised annual return.
What futures basis and options skew add
Futures basis is the difference between a dated future and spot. Annualizing it accounts for time to expiry. A positive basis can attract a trade that holds spot and shorts futures; the futures short then need not express an outright bearish view.
Options skew compares implied volatility across puts and calls at a stated expiry and delta. It can describe relative demand for protection or upside exposure. Choose a convention and keep it fixed: reversing the subtraction changes the sign, while changing the expiry changes the question.
Use the futures basis worked example for dated contracts. Perpetual funding and dated-futures basis use different mechanisms and should not be placed on one chart without explaining the conversion.
How to compare funding and open interest across venues
- Venue and contract: Specify where the measurement comes from and what it covers.
- Units: Examine contract or coin exposure alongside dollar notional.
- Carry: Align funding intervals and annualize dated futures basis consistently.
- Context: Read price changes, spot activity and liquidations alongside outstanding exposure.
CFTC reports provide another view for regulated futures: positions by trader category. The weekly release reports an earlier snapshot, so align its observation date rather than treating publication day as the day positions were established. Categories and net positions still do not reveal every underlying hedge.
Reading funding and open interest together
| Combination | Research question | Alternative explanation |
|---|---|---|
| OI rising, funding modest | Is new exposure accompanying stronger spot demand? | Hedges or arbitrage can also expand OI |
| OI rising, positive funding elevated | Is long exposure becoming costly and vulnerable to margin pressure? | A strong trend can maintain that demand for some time |
| OI falling, funding modest | Are participants reducing gross exposure? | Expiry or venue migration can reduce a local series |
| OI falling, positive funding elevated | Are remaining positions still paying a high carrying cost? | Local demand or a brief rate spike can dominate the reading |
Our framework asks what would force trading if the market moved against a concentrated position. The answer depends on collateral, margin rules, liquidity and exposure. A chart of funding alone cannot provide all of them.
When a thesis says a rally is “healthy,” look for evidence about how it is financed. When it says a market is “overleveraged,” look for a defined comparison and a plausible forced-trading mechanism. Both labels need more than a dramatic number.
Funding rate sources and methodology limits
Knowledge article reviewed on 12 October 2026. The diagram is Satswise’s conceptual reading framework, without live derivatives observations or a liquidation forecast. Contract specifications and reporting conventions should be checked for the instrument being examined.
- Coinbase — Funding rate units and collection schedule
- Deribit — Funding specifications
- Deribit — Open interest, futures and options metrics
- CME Group — Crypto basis trading
- CFTC — Market reports and Commitments of Traders
Updated 13 Oct 2026: Added a concise answer, evidence limits and topic reading paths. Underlying source reviews and chart observation cutoffs remain unchanged. Report a correction.