
How is Bitcoin MVRV calculated?
MVRV is market capitalization divided by realized capitalization. With consistent supply definitions, it also equals market price divided by realized price. The denominator models cost basis from coin movement and does not observe every investor’s purchase price.
Provider definitions and hypothetical calculations; no current MVRV or NUPL series is shown. Research methods.
Bitcoin MVRV is market capitalization divided by realized capitalization. It compares the market’s current valuation with a cost-basis estimate built from the prices at which coins last moved on-chain. With consistent supply definitions, MVRV also equals Bitcoin’s price divided by realized price.
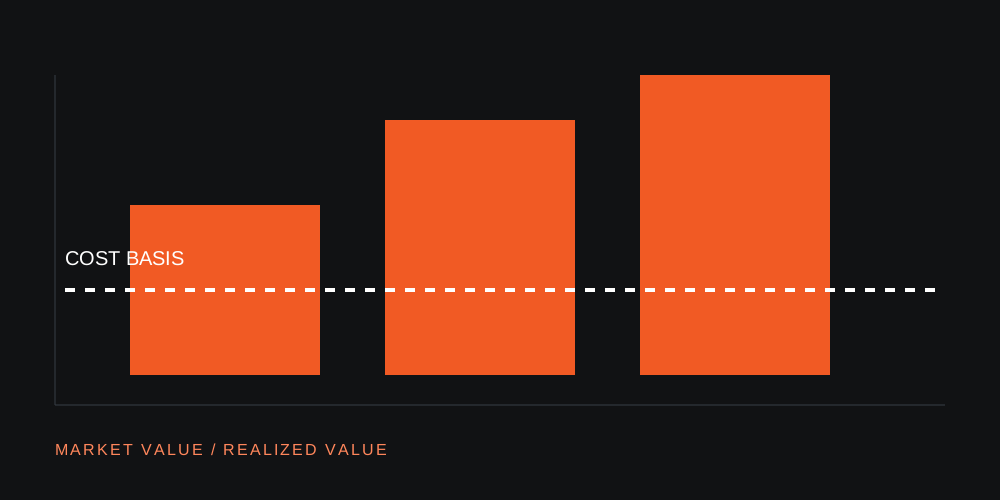
Market price $75,000 ÷ realized price $50,000 = MVRV 1.5.
NUPL = ($75,000 − $50,000) ÷ $75,000 = 33.3%.
What is Bitcoin realized price?
Market capitalization values the coin supply at the current price. Realized capitalization instead assigns coins the price associated with their last on-chain movement. Dividing realized capitalization by the corresponding supply gives realized price: an approximation of aggregate cost basis.
The word “approximation” matters. A coin can move without being bought. Custody reorganizations, internal transfers and old holdings can affect the measurement. Lost coins do not behave like active investors. The metric provides a reproducible lens on the chain, rather than an actual ledger of everyone’s purchase prices.
How to calculate and interpret the MVRV ratio
MVRV divides market capitalization by realized capitalization. With a consistent supply definition, it also equals price divided by realized price. A reading of 1 means those two valuations match; above or below 1 describes their relative position.
One cost basis, several market prices

At an example price of $75,000 and realized price of $50,000, MVRV is 1.5. That establishes a ratio. It does not establish that the asset is expensive in every future state, or that a particular top must follow.
How MVRV, NUPL and realized price overlap
NUPL expresses the difference between market and realized capitalization as a fraction of market capitalization. With matching definitions, NUPL = 1 − 1/MVRV. The example MVRV of 1.5 therefore corresponds to NUPL of about 33.3%.
MVRV = price ÷ realized price
NUPL = 1 − 1 ÷ MVRV
Displaying MVRV, NUPL and realized price together can make the relationships easier to understand. Treating agreement among them as independent evidence overstates what has been learned. A stronger assessment adds a different source of information, such as measured fund flows or derivatives positioning.
Short-term and long-term holder cost basis
Holder cohorts add information about coin age or entities’ holdings. Glassnode’s short-term holder realized-price endpoint uses unspent outputs younger than 155 days. Its entity-adjusted holder-supply methodology instead uses a smooth transition centred on 155 days. These are different classifications; a chart needs the definition of its specific series.
An increase in long-term holder supply may reflect coins simply aging into the category. A decrease may reflect older coins moving, without proving those coins were sold on an exchange. HODL waves show the distribution of coin ages; they do not identify every beneficial owner.
Our reading framework asks two questions separately: which cost basis is under pressure, and which cohort is changing? A recent-holder cost basis can help describe the condition of newer holdings. It is still a model-based estimate, with methodology that needs to stay consistent across comparisons.
The short-term holder realized-price guide shows how a cohort’s average can change as coins age, even without a new purchase. A provider-defined age boundary does not reveal an investor’s intention.
How SOPR adds evidence about moved coins
SOPR compares the value of spent outputs when spent with their value when created. Above 1 indicates aggregate profit on that basis; below 1 indicates loss. Raw, adjusted and entity-adjusted variants can differ, so name the series before comparing levels.
Use a consistent smoothing window to avoid giving one noisy day too much weight. Then distinguish “coins moved at a profit” from “investors sold coins for cash.” The first is an on-chain observation; the second needs evidence about the transaction’s purpose.
Read the SOPR worked example and variant comparison to see why an aggregate ratio weights output value differently from a simple average of individual gains.
A reading order for Bitcoin on-chain valuation
- Definition: Identify the supply, pricing and adjustment rules.
- Level and change: Read where the ratio sits and how it is moving.
- Cohort: Examine whether the aggregate conceals different holder conditions.
- Independent check: Add flows or positioning, and keep disagreements visible.
MVRV sources, methodology and scope
Knowledge article reviewed on 12 October 2026. The graph is an original hypothetical worked example. No current MVRV, NUPL, SOPR or holder-supply observation is represented. Definitions come from the linked providers; the reading order is Satswise’s interpretation.
- Coin Metrics — Realized capitalization methodology
- Coin Metrics — MVRV definition
- Glassnode — Entity-adjusted holder supply methodology
- Glassnode — Short-term holder realized price
- Glassnode — SOPR and NUPL indicator definitions
Updated 13 Oct 2026: Added a concise answer, evidence limits and topic reading paths. Underlying source reviews and chart observation cutoffs remain unchanged. Report a correction.