
What does Bitcoin SOPR measure?
SOPR compares spending-time and creation-time values for coins that moved on-chain. For an aggregate value-weighted ratio, above 1 indicates a profit and below 1 a loss on that basis. Unweighted averages and filtered variants can tell a different story.
Provider variants differ; figures and calculations are hypothetical, with no live SOPR observation. Research methods.
Which coins and values enter the ratio?
Bitcoin’s Spent Output Profit Ratio, or SOPR, compares the dollar value of coins when spent on-chain with their value when the corresponding outputs were created. A ratio above 1 means the spent outputs moved at an aggregate profit on that basis; below 1 means an aggregate loss. It describes the coins that moved, rather than the unrealized condition of the entire supply. Glassnode’s metric guide sets out this distinction.
“Spent” has a precise Bitcoin meaning: an existing transaction output was consumed by a transaction. It does not establish that someone sold bitcoin on an exchange. A wallet transfer can spend an output without changing its beneficial owner. Read SOPR as evidence about on-chain movement, with an interpretation that still needs context.
How is SOPR calculated?
SOPR = total USD value at spending
÷ total USD value at creation
For each included output, multiply its BTC amount by the dollar price at creation, then by the price at spending. Sum each set of dollar values before dividing. This is not the simple average of the individual output ratios. Coin Metrics distinguishes its value-weighted SOPR from an unweighted output version; they can answer different questions.
A small profitable output can coexist with a net loss.
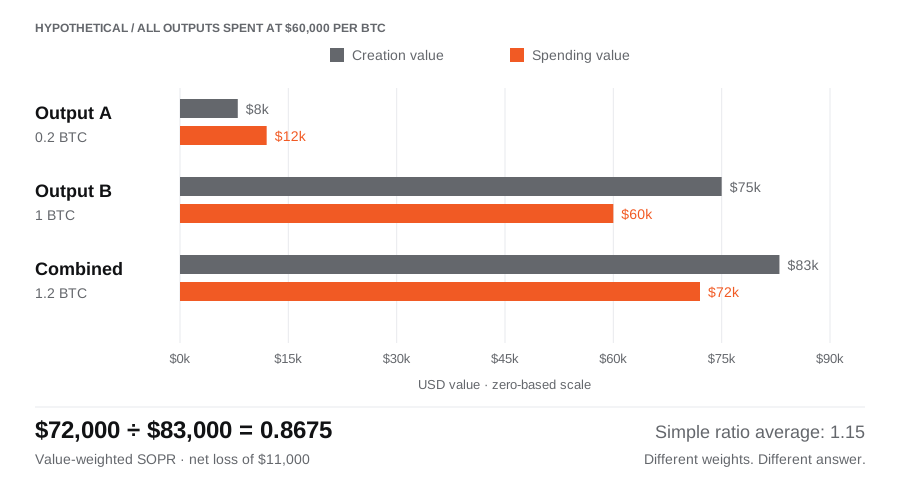
Suppose two outputs move when bitcoin trades at a hypothetical $60,000. Output A contains 0.2 BTC and was created at $40,000 per BTC. Its creation value is $8,000 and spending value is $12,000. Output B contains 1 BTC and was created at $75,000; its values are $75,000 and $60,000.
Weight the values before reading the ratio

| Output | BTC amount | Creation value | Spending value | Individual ratio |
|---|---|---|---|---|
| A | 0.2 BTC | $8,000 | $12,000 | 1.50 |
| B | 1 BTC | $75,000 | $60,000 | 0.80 |
| Combined | 1.2 BTC | $83,000 | $72,000 | 0.8675 |
The combined ratio is $72,000 ÷ $83,000, approximately 0.8675. Net value is $11,000 below the creation basis, or about 13.3% of that basis. The simple average of 1.50 and 0.80 is 1.15, which would suggest the opposite sign. Neither calculation tells us the proportion of investors who lost money: outputs are not a census of people.
Which SOPR series are you reading?
| Series | Included observations | Question it helps answer |
|---|---|---|
| SOPR | Spent outputs in the selected period | What is the aggregate spending-value ratio? |
| Adjusted SOPR (aSOPR) | Glassnode removes outputs with lifespans under one hour | How does the ratio look after filtering very short-lived outputs? |
| Short-term holder SOPR | Glassnode’s age-based series focuses on outputs younger than 155 days | How profitable is spending from the recent-output cohort? |
| Long-term holder SOPR | Glassnode’s API definition includes outputs at least 155 days old | How does spending from older outputs differ? |
These age and adjustment rules are Glassnode’s published definitions. Its original short-term holder methodology also describes excluding outputs younger than one hour from STH-SOPR. Do not splice series with different filters into a single apparent history. Entity-adjusted variants add another modeling choice; label the exact provider, series and interval.
What should an investor watch around 1?
Satswise’s reading framework separates a level from a sequence. One observation below 1 establishes aggregate loss realization for the included outputs. Repeated observations, a changed spending volume and a changed cohort mix provide more context. A low ratio on limited movement and the same ratio on heavy movement deserve separate descriptions.
Keep the smoothing method consistent. A seven-day arithmetic average of daily ratios differs from dividing the seven-day sums of spending and creation values; the latter gives more weight to periods with greater creation value. Write down which method a chart uses before comparing it with another chart.
Then add a different type of evidence. Short-term holder realized price describes the cost basis of unspent recent outputs, while SOPR describes spent outputs. MVRV and realized price explain valuation relative to modeled cost basis. Fund flows or derivatives positioning can add information that does not merely repackage the same on-chain inputs.
What can SOPR not tell you?
A reading of 1 is an aggregate break-even relationship, not proof that every included output broke even. A spike does not identify a market top, and losses do not establish that a bottom has arrived. Coins remaining dormant are absent from the calculation; trading inside custodial platforms may occur without the corresponding on-chain transfer. For the wider strategic framework, read the Bitcoin market-cycle guide.
Sources and scope.
Knowledge article reviewed on 12 October 2026. Calculations and diagram are original hypothetical examples. No live SOPR series, trading signal or price forecast is presented. Metric definitions come from the providers below; the reading framework is Satswise’s interpretation.
- Glassnode — SOPR definition and calculation
- Coin Metrics — Weighted and unweighted SOPR
- Glassnode — Adjusted and holder-cohort API definitions
- Glassnode — Holder age methodology and STH-SOPR filtering
Updated 13 Oct 2026: Added a concise answer, evidence limits and topic reading paths. Underlying source reviews and chart observation cutoffs remain unchanged. Report a correction.