
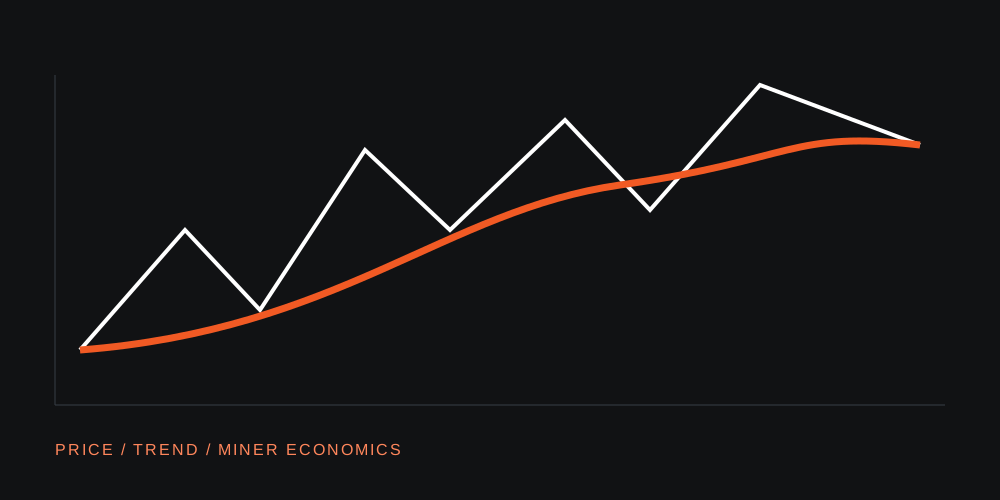
What is the Bitcoin Mayer Multiple?
The Mayer Multiple divides Bitcoin’s price by its 200-day simple moving average. A value above 1 places the price above that average; below 1 places it below. It measures distance from a historical trend, rather than fundamental value.
Completed daily Bitstamp closes through 11 October 2026; historical thresholds are not guarantees. Research methods.
What is Bitcoin’s 200-day moving average?
A moving average smooths past prices. The 200-day simple moving average gives equal weight to 200 daily observations. The Mayer Multiple divides the current price by that average. Both describe the same price series from a different angle.
Above-average price can indicate a stronger recent trend or a more extended move, depending on the question. A moving average follows the market with a lag. Calling it “support” does not turn it into an enforceable price floor.
Price relative to its 200-day average


Data: Bitstamp / CryptoDataDownload. Completed daily observations through 11 October 2026. Satswise calculations; fixed snapshot.
How to calculate the Mayer Multiple
200-day SMA = sum of the latest 200 daily closes ÷ 200.
Mayer Multiple = $80,000 close ÷ $50,000 SMA = 1.6.
In that example, price is 60% above its trailing average. It does not mean a 60% decline is required to return to the average: with the average held fixed, the fall from $80,000 to $50,000 would be 37.5%. In practice the average moves as older closes leave the window and new ones enter.
A 200-day average includes calendar days because Bitcoin trades through weekends. Identify the venue, currency pair and daily closing boundary; a UTC close can differ from a chart using another timezone. Start the indicator only after 200 complete observations. Mixing an intraday price with a completed-close series changes the definition.
How Bitcoin drawdown differs from distance to an average
Drawdown measures the fall from a preceding peak. State whether that peak uses daily closes or intraday trades, and whether it is a full-history or a window-specific maximum. Two honest charts can show different numbers because they use different definitions.
The cycle guide’s drawdown chart uses a running maximum of daily closes within a dataset that starts in November 2014. It records the path beneath the peak without importing a later high into an earlier observation.
Where miner economics fits into trend research
Miners earn the block subsidy and transaction fees, while facing operating and capital costs. Changes in price, difficulty, fees and energy costs can affect the economics of production. The issuance schedule controls one component of revenue; it does not describe every cost.
Why the Puell Multiple measures a different mechanism
Puell compares daily USD issuance value with its 365-day average. It describes miner issuance revenue relative to its history, while Mayer describes price relative to its history. The dedicated Bitcoin miner economics guide separates issuance from fees and works through hashprice, efficiency and electricity costs.
How to use trend indicators in a Bitcoin thesis
Trend indicators tell you how price compares with its own history. Miner indicators help investigate the economics of securing the network. Neither measures all new demand, and neither guarantees that owners will refuse to sell below a given level.
Our reading framework combines the trend with a proposed mechanism: what could sustain it, what pressure could disrupt it, and which observation would challenge the explanation? That makes the indicator part of a testable argument.
200-day moving average sources and chart methods
Knowledge article reviewed on 12 October 2026. Trend charts use Bitstamp BTC/USD closes; the full daily series is used for calculations, with local extrema retained when reducing display paths. One missing archive date is supplied by the same exchange’s daily API; see the chart methods. Miner profit, current hashprice and current Puell observations are not plotted. The separate miner guide contains the protocol subsidy diagram.
- CryptoDataDownload — Bitstamp price data
- Bitcoin.org — Halving and subsidy schedule
- Look Into Bitcoin — Puell Multiple definition
- Bitbo — Mayer Multiple definition
- Luxor / Hashrate Index — Hashprice definition
Updated 13 Oct 2026: Added a concise answer, evidence limits and topic reading paths. Underlying source reviews and chart observation cutoffs remain unchanged. Report a correction.